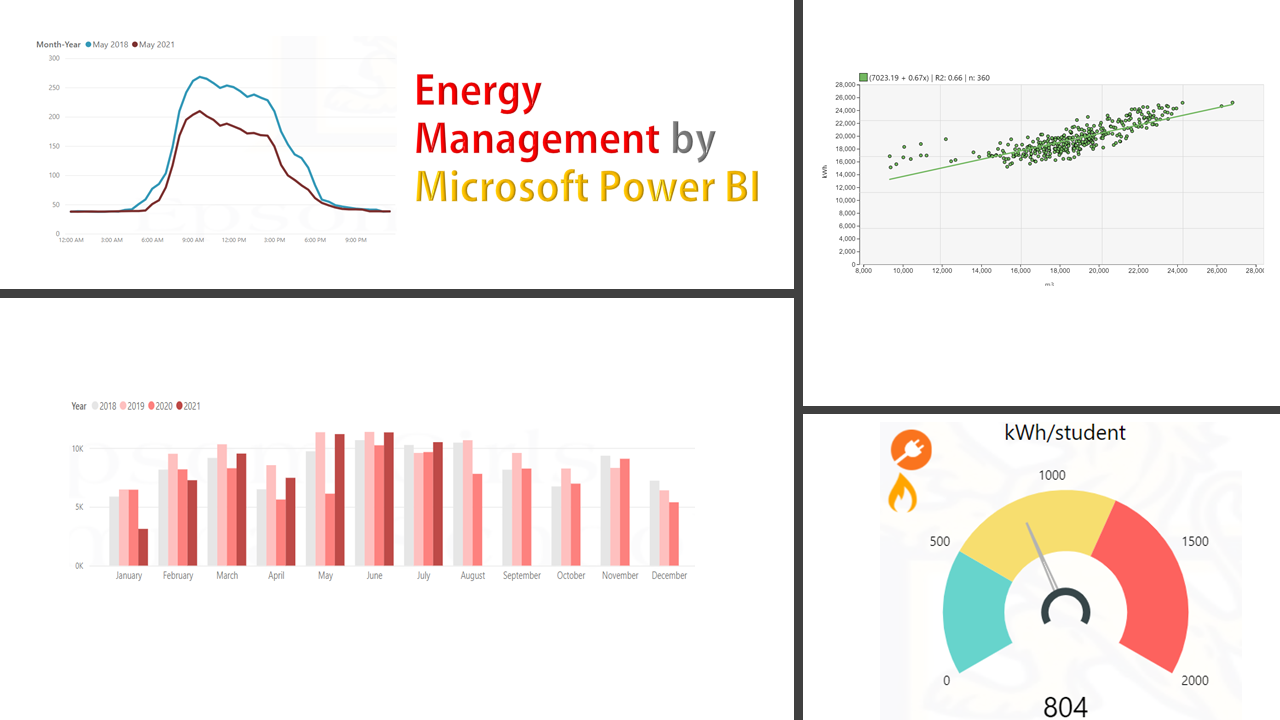
10 years ago, Microsoft company introduced a cloud-based suite of business intelligence that will help us analyze and view data through compelling visualizations and interactive reports and dashboards. In the context of energy management, continuous review, and analyzing energy usages are imperative tasks as prerequisites to identify the opportunities for saving. Initially inspired by Simon Ross (at Economech Analytics Ltd.), I have been using this tool for the last 2.5 years to develop some reporting platforms for our clients who were keen to understand more about their energy usage and performance. In this series of posts, I am going to walk you through this amazing solution and how to apply it to energy management. I borrow the examples from the Utility Management Platform developed for Epsom Girls Grammar School in Auckland thanks to Bronwyn McGill, the school manager, who kindly provided me permission to use their data. The school started using this platform in Aug. 2019. In May 2021 and following two years of persistent attempts, the school became the first NZ organization to receive ISO50001, the global standard certification for Energy Management Systems.
In this part, I will concisely explain how the energy data can be collected and transformed into a more meaningful form (information). My examples would apply to the New Zealand energy market however the concept of data collection and management does not vary if the energy retailer provides a different format of data.
- Power Metering: In New Zealand, the energy is being supplied by multiple retailers. To access the data you need to find out the meter’s unique number or ICP. An ICP is an Installation Control Point. Each ICP has a unique number that identifies it as an individual power connection. If the meter is smart, you can request and receive the data in a half-hour interval for your last 24 months’ worth of consumption. The retailer must deliver the most granular data it has used for each consumer. This is a format of data you might receive. The file extension could be .xlsx or .csv both of which are easy to handle by Power Bi. As seen, the usage is logged every half-hour in kWh. If the smart meter is Time of Use, you can receive the reactive power in kVArh as well which is useful for further analysis. Some retailers like Meridian may provide you a portal to access your data in your desired format and frequency whilst some others send you data only on request.

- Data transformation: Using Get Data, you can pull in the data you receive into Microsoft Power Bi. This menu is available both in Power Bi Desktop and Query editor. You need to group the data to a full hour to simplify the presentation though some energy analysts prefer dealing with 48 half-hour records a day, I suggest you aggregate these intervals and get the usage for every full hour. You’d better split the column date/time and remove the ones you won’t use (e.g. Account number in this case). Make sure you specify the right data format for each column. You may need to combine one ICP with many others, so keep the format simple and consistent.

- Gas/Water Meters: The concept explained above can be applied to other meter data. However, at present most of the revenue gas and water meters are read monthly and sometimes based on estimated readings which are not accurate for energy management. If a gas meter is smart (Time of Use), you may request the hourly usage from your retailer. At the time of writing this article, Watercare in Auckland is widely promoting and installing smart meters for large consumers so you may contact them if you wish to have some. With smart meters, you are able to receive the water hourly usage data on a daily basis.
In the next part, I will explain how to collect and maintain other useful data from each revenue meter.

