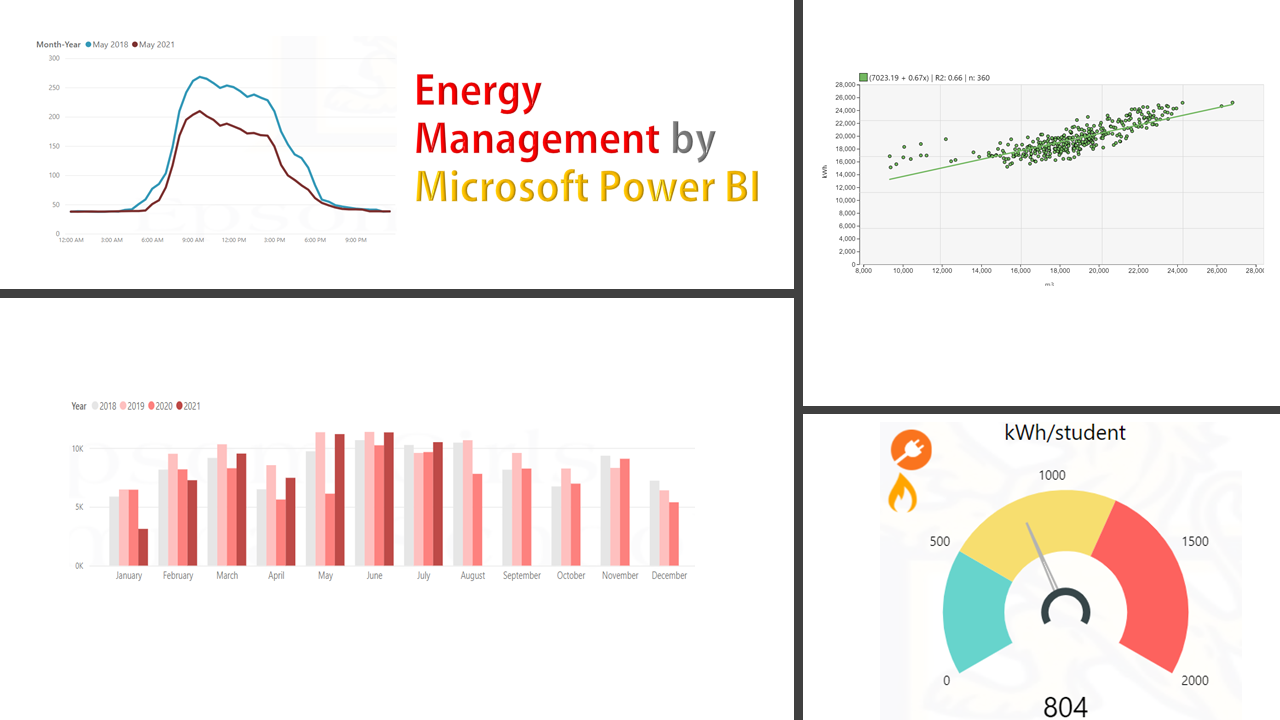
In the context of energy management, having a baseline model as a reference for energy consumption has been highly recommended. An energy baseline is a mathematical (simple or complex) model representing the relationship between energy usage vs. energy drivers or the variables that influence this usage. Using the ‘Regression’ visual in Microsoft Power Bi provides you a lot of insights and ideas about how energy is being used and why! Using this technique with excel might end up with the same outcomes but the level of interaction and attraction of the graphs in Power Bi is outstanding. You may easily toggle the energy users, variables, timeline, and other inputs., include or exclude them in the model with a flick. Of course, this visual will be viewable when only one variable comes to play. A multi-variable regression, unfortunately, cannot be handled with this visual however the opportunity of trying the different variables and see which becomes the most single relevant one is something not to be missed.

The above example is borrowed from an urban water service project. On the x-axis, you may choose a variable like the amount of water delivered (the energy driver). And, the y-axis could be the pumping energy user. A very fine and neat correlation has come out. The line slope (0.43) is the amount of additional energy required to pump one more cubic meter of water. Isn’t it amazing? The dots represent each day of these 366 data (one year). The equation on the top left of the graph is the energy baseline given that the correlation ratio is significantly high in this case.
The outcome of regression modeling is not always promising. The following depicts how energy is used against the outside temperature (HDD) for a school building during the weekends. 106 dots have been picked in this sample. Even a poor correlation like this has something to learn from. It shows the energy varies indifferently to the heating required. This is obvious as, during a weekend, no heating equipment like a heat pump is used so the variation is likely due to other factors. The level of dispersion of the dots around the line (which is automatically added by this feature) may also give us some ideas of why on some weekends the energy behavior is different. The fitting line even in a poor regression is an indicator of the average daily usage (900kWh/weekend in this case). Interestingly if we switch to ‘weekday’ we observe a better correlation with HDD (heating degree days) which makes sense. Hence, we might end up with different baselines for different day types.

Needless to say that clustering the data is a useful technique. You may look at the regression outcome for your hourly/daily/monthly energy usage and group the variables (e.g. outside temperature, occupancy rate, et.) accordingly. Also grouping the data based on the daytype.
In the graph below, we managed to slice the timeline to include only the daily data for 2 years. The total energy usage versus the outside temperature. Clustering the data on this graph is helpful in such a way that we can look at the weekday and weekends separately. Listed below, the lessons I would learn from this graph:
- I expect this site uses relatively higher electricity on a weekday.
- Energy usage behaves differently from ‘weekday’ to a ‘weekend day’ with or without respect to the outside temperature. There is also a non-linear curve-shaped data form observed in the black chart so maybe a linear regression is not a useful method for showing this relationship.
- Those 4 or 5 black dots that are closer to the green line (the fitting line of the weekend) are worthwhile for further investigation so are the green ones in the proximity of the black dots! the former set delineates weekdays with good performance while the latter indicates more than expected usage.
- Outside temperature (HDD in this case) is definitely not an influential variable on the energy consumption of this specific site. So one needs to further seek the other variables to incorporate into the model.

Talking about regression and its application in energy management may take days and nights! and we are here just to quickly show you there is a powerful feature in Power Bi (named Craydec Regression Chart) you can plug and play to your report as an analytical tool for energy baseline modeling and performance tracking. In the presence of an acceptable correlation, it can be also used as a tool for the evaluation of action plans and calculation of savings. Please write to me if have any inquiry.

