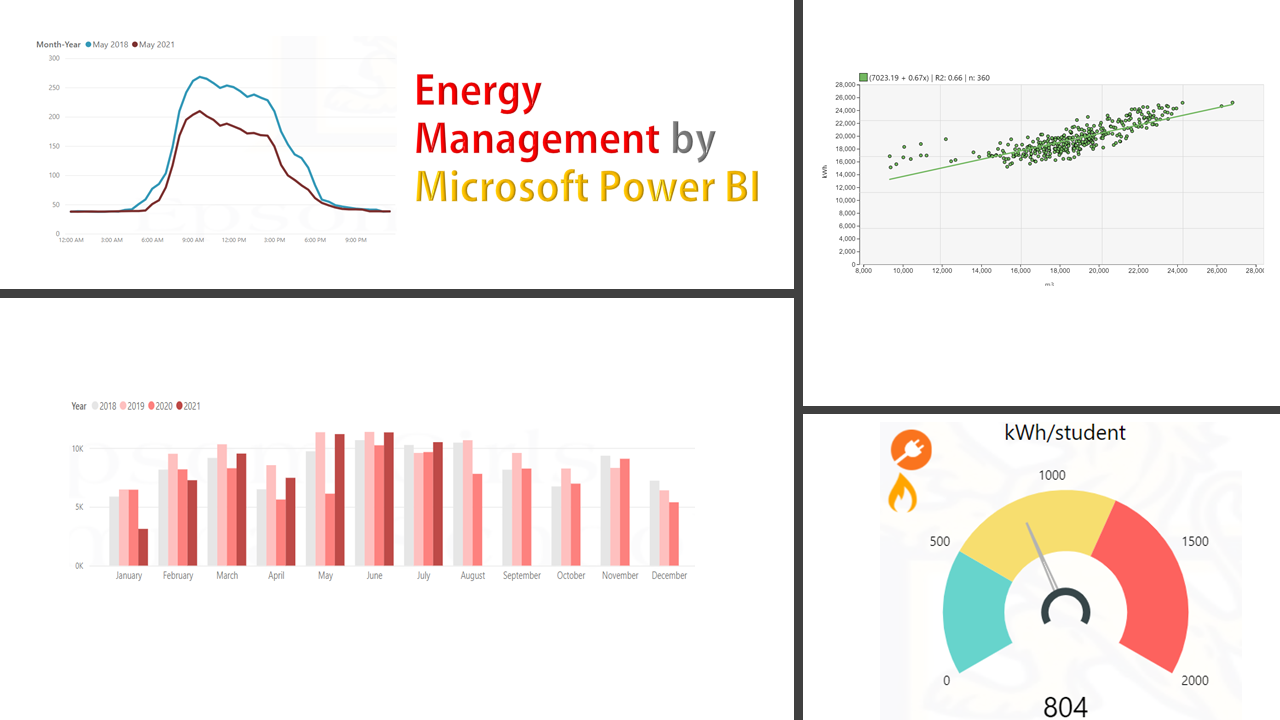
Managers would usually love to take a quick look at the overall performance indicators rather than spending time on worksheets, graphs, and other forms of showing historical usages. Performance indicators are essential when you want to simply and smoothly monitor how your business is going. In an energy management system, it is required to identify and adopt EnPi (energy performance indicators) to represent and reflect how energy is being used in your organization. Setting the appropriate and relevant EnPi does not depend on which software you use. However, as I am going to explain, using Power Bi is a huge relief when someone has to regularly calculate and report these metrics.

Use the ‘Gauge’ visual in the Power Bi desktop to set a calculated ‘measures’ that are to be updated automatically at the end of each period and indicate performance indicators. The metrics could be defined based upon the context of the organization as well as what the stakeholders (e.g. managers) would like to track (and share). The above indicators calculate the per capita energy/water usage, energy-related emission, and renewable energy generation of a university campus on a monthly basis. Creating and updating this with ‘Excel’ would involve much more effort and time.

In the figure above, another way of showing the indicators is using the ‘Tableua’ concept. This way, as you go forward, you see how different types of energy across different buildings are performing. The metric here is the ‘deviation % of Year to Date usage’ to be compared with the same period last time. For instance, if the total electricity usage of campus 1 from Jan-Aug 2021 exceeds over 10% of that of the same period last year (Jan-Aug 2020), the color would turn to red for 10%, yellow to below 10% increase, and green for less usage. This is a quick awareness for a manager to further investigate (or drill down on the other graphs) for the red areas and keep looking at the yellow ones in the future hence save a lot of time to analyze. Needless to say, green is not showing necessarily a saving because of your good practice and can be an effect of a long shutdown. A regression model with appropriate variables is a rather reliable reference to compare the actual usage with and conclude the savings. The concept of showing the colorful tableau can be simply applied to your other indicators.

The above chart is depicting the EII indicator for the energy performance of a site. It is worked out by dividing the ‘actual daily usage’ by ‘expected daily usage’ calculated from the regression equation (energy baseline model Ref. part 4 of this article). This is simple while a robust EnPi. It is supposed to be smoothly moving around 1 and if you have any action plan, you would expect the values to fall less than 1. The unusual changes or outliers can be further investigated and are easily detected with this graph.
Alert notification:
It is apparent that we cannot expect the managers to constantly monitor the graphs and indicators every day and hour. So, it makes more sense we notify them when something goes off the track! Here, we could manage to set up an alert to send to a school manager once the hourly (or total daily) water usage in the site reading from a smart meter exceeds a certain threshold. With this simple feature of Power Bi, the school could save a significant amount of water that would have been wasted from unnoticed leakages many of which occurred during night or weekend.

