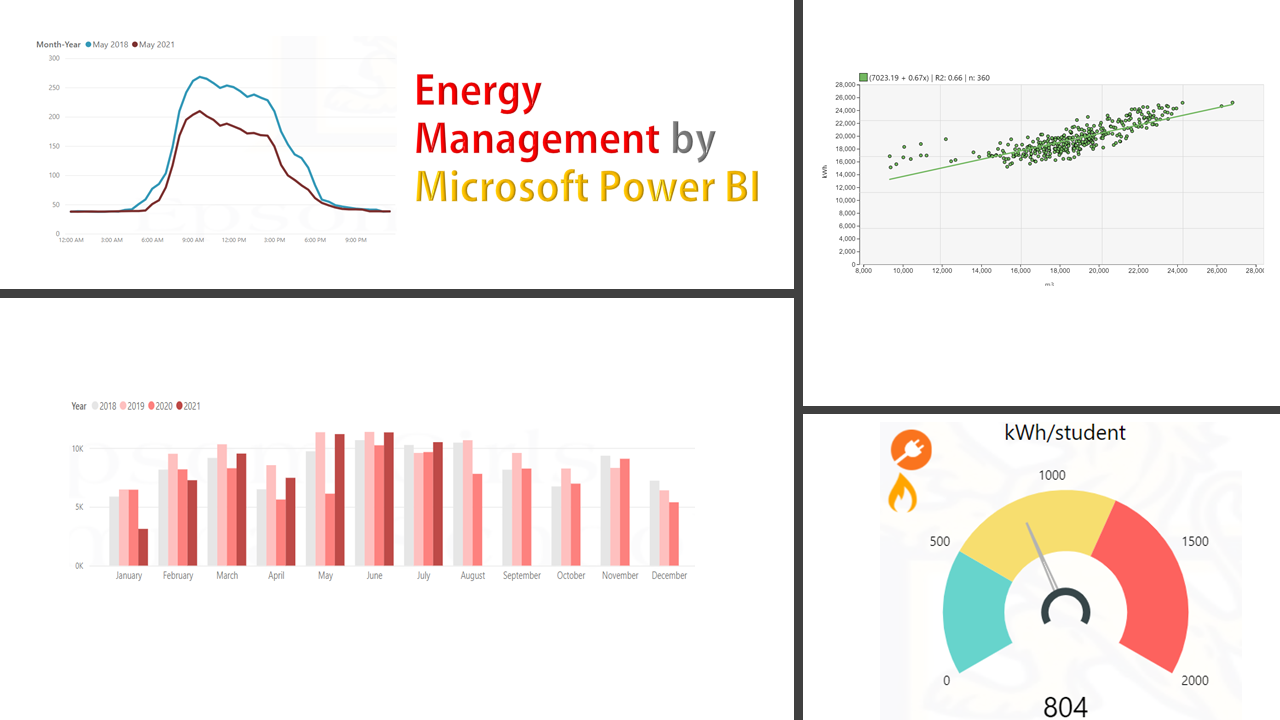
In this post, I am going to show you how a Power Bi’s visual can be helpful in understanding the energy load and what we find out by looking at the load graphs. Assuming that we still work with the same dataset I explained in the previous articles, I would suggest you pick the ‘line chart’ and assign ‘Time’ to the x-axis and ‘power’ (e.g. in kWh) to the y-axis. Display two graphs next to each other with one showing the ‘average power load’ and the other illustrating the ‘maximum power load’. Assign ‘month-year to the graph’s legends so you can compare and analyze the loads. Switching between these modes (maximum, minimum, sum, average) on a specific variable (table column) is quite easy in Power Bi.

Load profile interpretation: the line charts above literally depicts how energy (electricity in this example) has been used throughout a 24-hour period in a school’s buildings for 3 years same month. Since the school term in July appears to have the same number of holidays, comparing these graphs will be meaningful. While the ‘Average’ graph is showing how the average energy usage has dropped in 2021 comparing the other 2 years, the ‘Max’ graph indicates an insignificant difference between these periods. But why is that and why the separate interpretations of these graphs are important to complete the puzzle?

- The ‘Average’ graph might imply the impact of energy conservation measures (we understand that the energy for heating is not supplied by electricity so the drop is not due to the seasonal effect). It appears that the amount of saving (difference between 2020 and the past two years) is improved meaningfully between 09:00 AM-03:00 PM while after and especially before this duration, the saving is not a reasonable amount. It could delineate that the efforts we made in 2021 mostly impacted the equipment being used during the school working hours and it has not improved the baseload (usage outside of working hours) as such. Non-stop energy consumers like the computer servers, outside lighting, security cameras, etc might be the reason why the baseload has not been reduced. In this case, as we were their energy adviser and helped the school to implement some action plans (e.g. changing the lighting system to LED) this fall in July 2021 could be perceived as the result of such improvement projects. Note, the ‘sum’ and ‘average’ graphs will exactly display the same pattern and could be interpreted likewise.

- The ‘Max’ graph though has a different meaning. While the line curves are more touching in this graph during the peak time, the difference starts to occur around 12:00 PM-03:00 PM, does it mean we have not saved any energy! This graph features the equipment (s) that were using the maximum power during the time period. Therefore, this graph can be useful to tell us if we have taken any good action towards cutting down the maximum load (the large users) or peak shaving (the leveling out peaks in energy usage that is a common practice by industrial users). We still have around 330-340kWh of load running between 09:00 AM-10:00 AM. Comparing this to the ‘Average’ graph, we realize the lighting was not the large user because despite making it more efficient, the maximum load still exists around the same values as those of past years. It is also observed that in 2020, the school could have phased out some of the equipment that was running between 04:00 PM-07:00 PM resulting in a drop in the maximum load. However, looking back to the Average graph, it appears that this attempt has been neutralized by using more of the existing equipment after this change!
In summary, to assess the effectiveness of implemented energy efficiency projects and in the absence of seasonal effect and given the consistency of the number of working days, the ‘sum’ or ‘average’ graph can be used to indicate the saving. However, if the projects involve capital works and asset changes, it is advised some solid methods of energy saving measurement and verification (e.g. IPMVP) be used rather than just looking at the monthly changes. To realize if we have impacted the largest users, the maximum graph could be taken into our assessment. In most of the case, the Pareto principle of 80/20 underlies: less than 20% of the equipment uses more than 80% of the energy! and it makes sense to start investing in the efficiency of the big users. Analysis of the ‘Max’ graph is also a good initial point to design the alternative system. For example, if we are changing a heating system from a gas-boiler to an electric heat pump, the max. of a gas heating load profile may indicate the heating demand to be designed in the new system.

