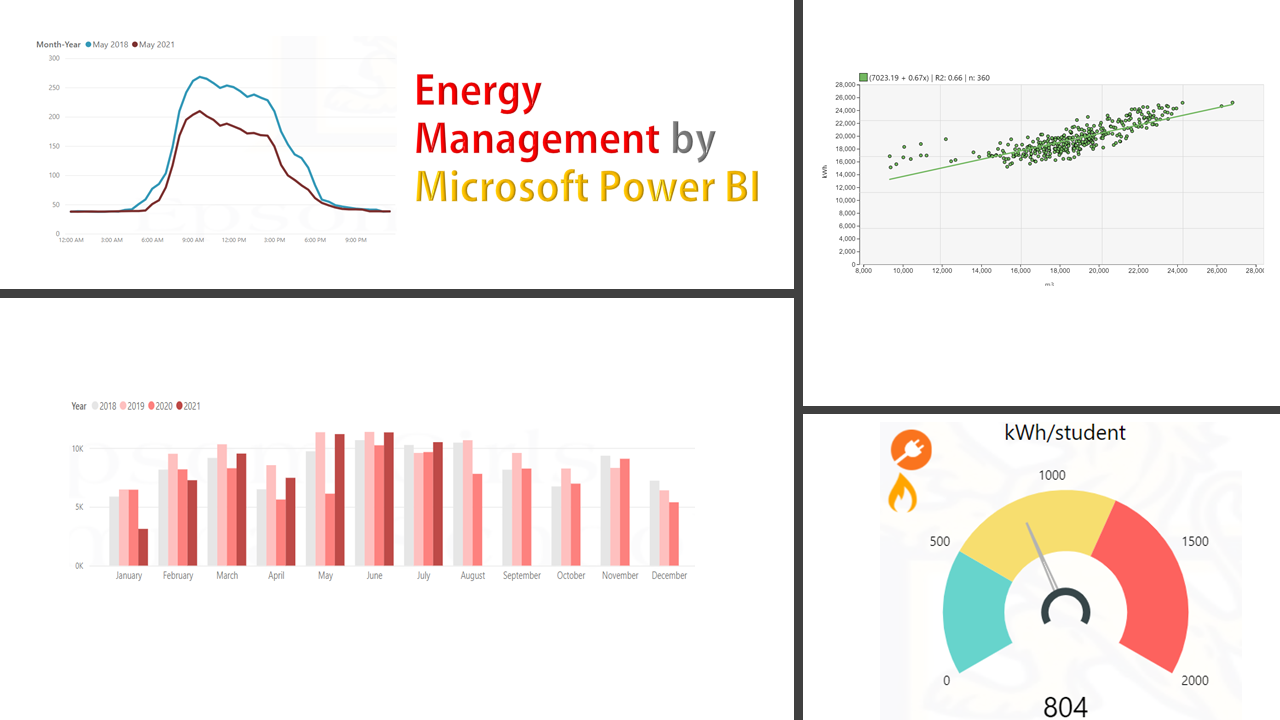
If you are aiming to systematically and continuously manage your energy performance, a periodeic review of the energy usage and its historical trend is a key part. Despite data availability, many of the organizations ignore this simple and primary task mainly due to the complexity of summarizing and visualizing the data into excel charts and graphs. Using Microsoft Power Bi has an absolute advantage over excel when it comes to viewing your energy consumption over time with the ability to abstract, drilling up/down on the data. In the previous part, I showed you how the raw data might be received and this can be a source to pull in Power Bi. While there might be several approaches to visualize the data, I recommend you use ‘Stack columned chart’ which enables you to drill down and see what happened in the past. You may have the areas (the ICPs) as a button menu to choose from. Using this Power Bi graph gives you a quick insight into how much is the total usage and how over the past few years, your consumption has changed.

Using the same graph you can drill down (clicking on the double arrow facing down) to see how energy has been used across a 24-hour period. This quickly tells you whether or not an energy user is sensitive to the working hours. In this case, the main site load is correlated with the occupation rate of the buildings while the swimming pool load has been relatively constant.

If you simply drill down to the daily profile, depends on the context of the organization, you will see the week-day usage which differs from weekend usage. The chart below displays a drill-down on the month of June 2021 for school educational buildings with a drop appears almost every 5 times. This can be an initial indication of the weekend baseload. This can be compared to the other months to see if for example the weekend baseload is impacted by seasons. A weekend baseload is a significant variable indicating the low-hanging fruits to pick in energy saving. They are the good starting points to question why we use this much energy when no one was using the buildings? In this case, the weekend load is almost a third of a week-day load. Another interesting finding is the total daily usage barely exceeds 3,000kWh which can be a control limit to be notified when occurring in the future.

The last graph I want to introduce is the monthly comparison. To discard the seasonal effect on energy usage, it is suggested the monthly usage be compared with the same month past years. Although this comparison has to be interpreted very carefully due to changes in the other drivers, it may give you some initial ideas to track your performance. I used the ‘Clustered column chart’ visual in Power Bi desktop for the chart below. You should choose the ‘month’ on the x-axis and choose the ‘year’ as the legend with lighter colors representing the older year. The usage has been constantly increased over the last years which could be the result of site expansion, poor performance, occupancy rate, or less likely in this case, global warming!

In the next part, I will describe how to view and analyze the power profile charts

